
Class 9th - 12th Track6 Weeks CohortTopic-Linked Attendance Enabled

Power BI — Data Visualization & Dashboards

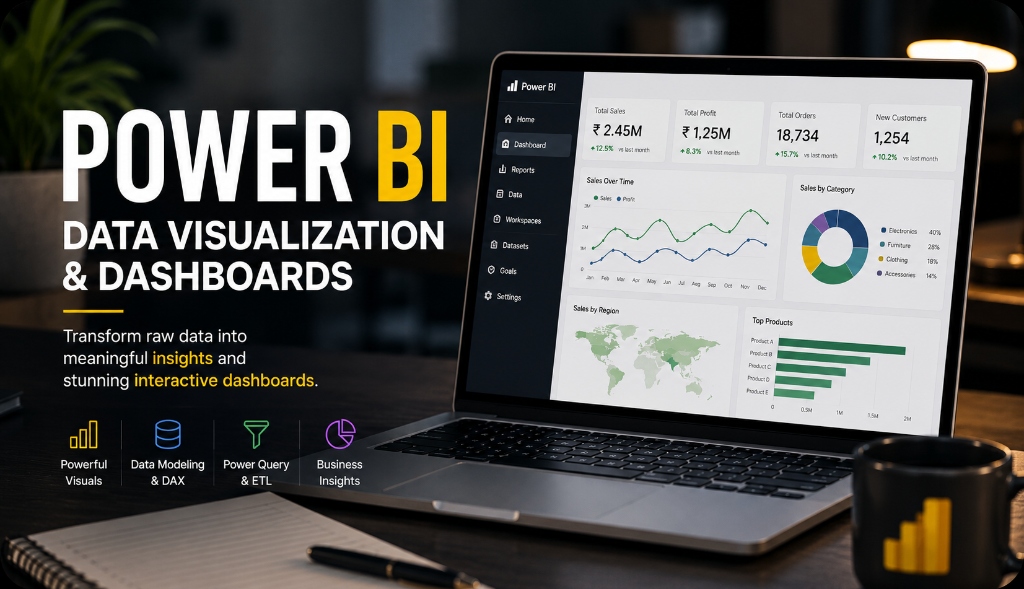
Transform raw data into compelling interactive business intelligence reports. Learn Power Query ETL, Star Schema data modeling, DAX measures, time intelligence, and cloud publishing.

Key Skills You Will Master:
Power BI DesktopPower Query ETLData ModelingDAX MeasuresTime IntelligenceCloud Service
Vikramaditya Iyer
Lead Instructor
Vikramaditya Iyer
Ex-Tech Lead & STEM Mentor
Power BI — Data Visualization & Dashboards
Total Program Fee (Full Cohort + Materials)
2,9994,499Save 33%
Choose Your CohortLive Interactive
Next cohort starting next weekend • 5:00 PM IST
10 Live Hybrid Interactive Sessions
10 Granular Tracked Topics
Downloadable datasets, cheatsheets & Jupyter notebooks
Verifiable Certificate upon 85%+ topic completion
Syllabus Breakdown

Course Structure & Tracked Topics

Click on any module to view live sessions and the exact list of topics tested & tracked for attendance.

Session 1
Session 1: Introduction & Environment Setup
90 mins
Attendance-Tracked Topics (1):
1Power BI Interface & Connecting to Excel/CSV/Web
🎯 Hands-on Mini Task:Connect Power BI to Public Demographic Data
Import web data and create preliminary card metrics.
Session 2
Session 2: Power Query Data Transformation (ETL)
90 mins
Attendance-Tracked Topics (1):
1Data Cleaning, Unpivoting, Conditional Columns & Merging
Session 3
Session 3: Data Modeling & Star Schema
90 mins
Attendance-Tracked Topics (1):
1Fact vs Dimension Tables & 1-to-Many Relationships
Beginner Milestone: Cleaned Multi-Table Global Supply Chain Model

Ingest 4 disparate files into Power Query, enforce types, and construct a verified Star Schema relationship model.

Deliverable: Power BI Data Model with active 1-to-many relationships and zero circular links.
Session 4
Session 4: Core Visuals & Conditional Formatting
90 mins
Attendance-Tracked Topics (1):
1Bar, Line, Cards, Table, Matrix & Tooltip Formatting
Session 5
Session 5: Advanced Visuals & Interactivity
90 mins
Attendance-Tracked Topics (1):
1Maps, Treemaps, Slicers, Drill-Downs & Sync Slicers
🎯 Hands-on Mini Task:Customer Demographics Geographic Map Drill-Down
Configure drill-downs from country down to city-level sales.
Session 6
Session 6: Introduction to DAX Formulas
90 mins
Attendance-Tracked Topics (1):
1Calculated Columns vs Measures (SUM, COUNTROWS, DIVIDE)
Session 7
Session 7: Intermediate DAX & CALCULATE
90 mins
Attendance-Tracked Topics (1):
1Row Context vs Filter Context & the CALCULATE Function
🎯 Hands-on Mini Task:YTD Revenue & % Contribution DAX Measures
Author CALCULATE and ALL measures to compute market share percentages.
Intermediate Milestone: Regional Retail Store Performance Report

A 2-page interactive report with custom DAX measures for profit margin %, synchronized date slicers, and drill-downs.

Deliverable: Interactive Power BI report with synchronized cross-filtering.
Session 8
Session 8: Time Intelligence DAX Functions
90 mins
Attendance-Tracked Topics (1):
1Date Tables, SAMEPERIODLASTYEAR & YoY Growth Metrics
Session 9
Session 9: Dashboard UX, Bookmarks & Tooltips
90 mins
Attendance-Tracked Topics (1):
1Bookmarks for Toggle Views, Themes & Mobile Layouts
Session 10
Session 10: Cloud Publishing & Final Presentation
90 mins
Attendance-Tracked Topics (1):
1Power BI Service, Scheduled Refreshes & Sharing
Graduation Capstone

Executive SaaS Business Performance & Churn Dashboard

Construct a multi-page Power BI dashboard analyzing MRR, ARR, customer churn, and representative quota attainment with YoY time intelligence.

Deliverable:
.PBIX File + Published Power BI Web Report Link

What You Will Be Able To Do

Clean and shape complex messy datasets in Power Query ETL
Build scalable Star Schema relational data models with 1-to-many links
Author custom business KPI measures using intermediate & advanced DAX
Publish interactive, mobile-responsive dashboard reports to Power BI Service

Prerequisites

Basic Excel understanding recommended.

Unsure if this fits your current grade?

Schedule a 10-minute discovery call with our academic advisor.