
BTech / BCA Track14 Weeks CohortTopic-Linked Attendance Enabled Best Excel course for students

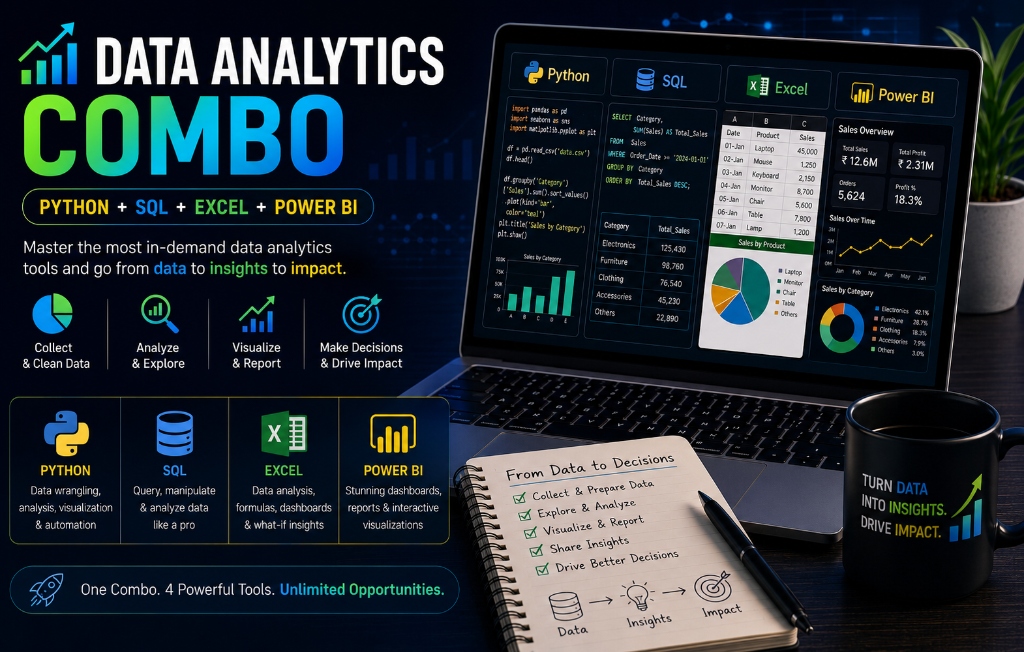
Data Analytics Combo (Python + SQL + Excel + Power BI)

Best Excel course for students & career switchers — Learn XLOOKUP and Data Cleaning online

The flagship, comprehensive all-in-one data career program. Master Python data science, advanced SQL querying, Excel financial modeling, Power BI business intelligence, and foundational predictive machine learning.

Key Skills You Will Master:
Python Data ScienceAdvanced SQLPower BI DashboardsExcel ModelingMachine Learning BasicsETL
Lead Instructor Vikramaditya Iyer
Lead Instructor
Vikramaditya Iyer
Ex-Tech Lead & STEM Mentor (IIT Madras Alum)
Master Data Analytics Combo (Python + SQL + Excel + Power BI) — Online Course Overview & Curriculum Thumbnail
Total Program Fee (Full Cohort + Materials)
₹6,999₹9,999Save 30%
Choose Your CohortLive Interactive
Next cohort starting next weekend • 5:00 PM IST
14 Live Hybrid Interactive Sessions
14 Granular Tracked Topics
Downloadable datasets, cheatsheets & spreadsheets
Verifiable Certificate upon 85%+ topic completion
Syllabus Breakdown

Course Structure — Learn XLOOKUP and Data Cleaning online

The best Excel course for students and professionals. Click on any module to inspect live sessions and the exact syllabus tested & tracked for attendance.

Session 1 • 90 Minutes Live

Session 1: Analytics Thinking & Setup

Granular Tracked Topics (1):
Data Analytics Lifecycle & Environment Setup
Session 2 • 90 Minutes Live

Session 2: Excel for Fast Exploratory Analysis

Granular Tracked Topics (1):
XLOOKUP, SUMIFS, Pivot Tables & Slicers
Session 3 • 90 Minutes Live

Session 3: Python & NumPy Refresher

Granular Tracked Topics (1):
Python Syntax & NumPy Vectorized Computations
Session 4 • 90 Minutes Live

Session 4: Pandas DataFrames & Data Cleaning

Granular Tracked Topics (1):
Loading CSV/Excel, Filtering & Missing Data Handling
Session 5 • 90 Minutes Live

Session 5: EDA & Matplotlib / Seaborn

Granular Tracked Topics (1):
Groupby, Histograms, Scatter Plots & Heatmaps
Beginner Milestone: Multi-Source Customer Spending Audit

Consolidate raw Excel/CSV data using Pandas, clean anomalies, and present a visual EDA report.

Deliverable: Jupyter Notebook with EDA and visualizations.
Session 1 • 90 Minutes Live

Session 6: SQL Querying for Analysts

Granular Tracked Topics (1):
SELECT, WHERE, GROUP BY, Aggregates
Session 2 • 90 Minutes Live

Session 7: Multi-Table Joins & Schema Traversal

Granular Tracked Topics (1):
INNER/LEFT Joins across Transactions & Catalogs
Session 3 • 90 Minutes Live

Session 8: SQL Window Functions (RANK / LAG)

Granular Tracked Topics (1):
ROW_NUMBER, DENSE_RANK, LAG, Moving Averages
Session 4 • 90 Minutes Live

Session 9: Power BI ETL & Data Modeling

Granular Tracked Topics (1):
Power Query Transformations & Star Schema Links
Session 5 • 90 Minutes Live

Session 10: DAX Measures & Time Intelligence

Granular Tracked Topics (1):
CALCULATE, YoY Growth, Slicers & Interactive UX
Intermediate Milestone: Full-Stack Retail Sales & BI Dashboard

Extract metrics from SQL into Power BI, design custom DAX KPI cards, and produce a 3-page dashboard.

Deliverable: Power BI Dashboard + SQL Extraction Script.
Session 1 • 90 Minutes Live

Session 11: Machine Learning Overview for Analysts

Granular Tracked Topics (1):
Supervised vs Unsupervised ML & Scikit-Learn Basics
Session 2 • 90 Minutes Live

Session 12: Predictive Regression Modeling

Granular Tracked Topics (1):
Linear Regression & Revenue Forecasting in Python
Session 3 • 90 Minutes Live

Session 13: Customer Churn Classification & K-Means

Granular Tracked Topics (1):
Decision Trees, Logistic Regression & K-Means Clustering
Session 4 • 90 Minutes Live

Session 14: End-to-End Capstone Defense

Granular Tracked Topics (1):
Portfolio Presentation & Stakeholder Recommendations
Graduation Capstone Portfolio

End-to-End Enterprise Analytics & Churn Prediction Solution

Ingest 100,000+ customer records from SQL into Python, conduct EDA, train a Scikit-Learn churn prediction model, and build a live executive Power BI dashboard.

Deliverable:
Python Notebook + SQL Pipeline + Power BI Live Dashboard

What You Will Be Able To Do — Practical Excel Mastery

Master the complete end-to-end modern data stack (Python, SQL, Excel, Power BI)
Automate extraction from SQL databases into clean Pandas DataFrames
Create executive BI dashboards with advanced DAX and time intelligence
Train Scikit-Learn machine learning models to forecast churn and revenue trends

Prerequisites

No prior coding experience required. Fast-paced comprehensive track.

Pdhoindia AI Assistant
Ask me anything about courses, pricing & more
Hi there! 👋 I'm the Pdhoindia AI Assistant. I can help you with courses, pricing, schedules, refund policies, and more.
What would you like to know?
Powered by Pdhoindia Knowledge Base